Первый слайд презентации
3D technologies in monitoring forest structures M ihai-daniel ni ță
Слайд 2: TIMBER worlDwide
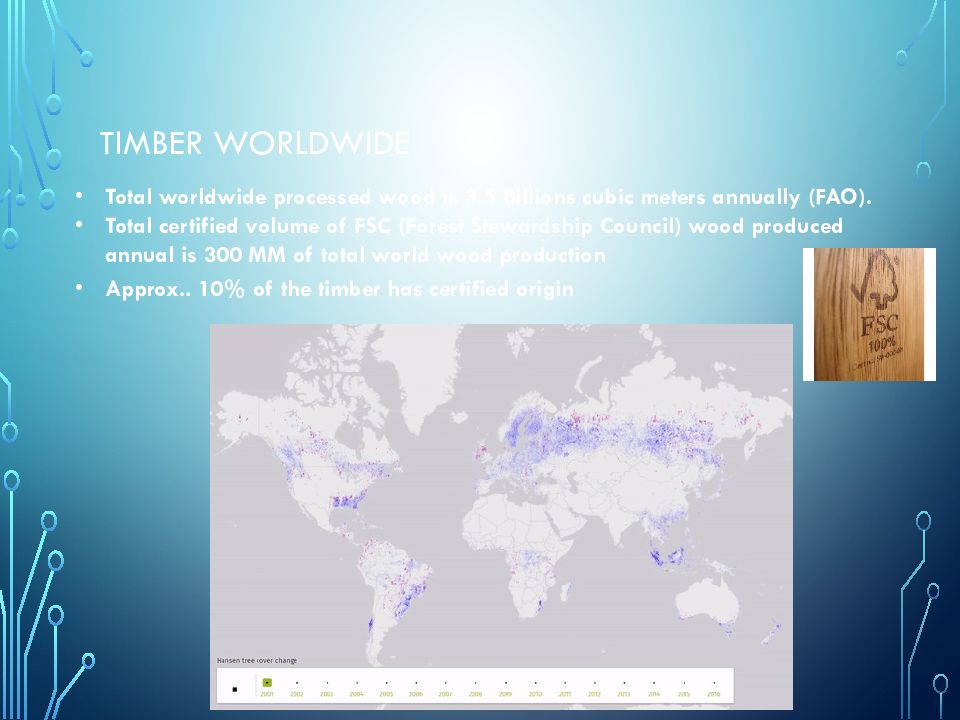
Total worldwide processed wood is 3.5 Billions cubic meters annually (FAO). Total certified volume of FSC (Forest Stewardship Council) wood produced annual is 300 MM of total world wood production Approx.. 10% of the timber has certified origin
Слайд 3
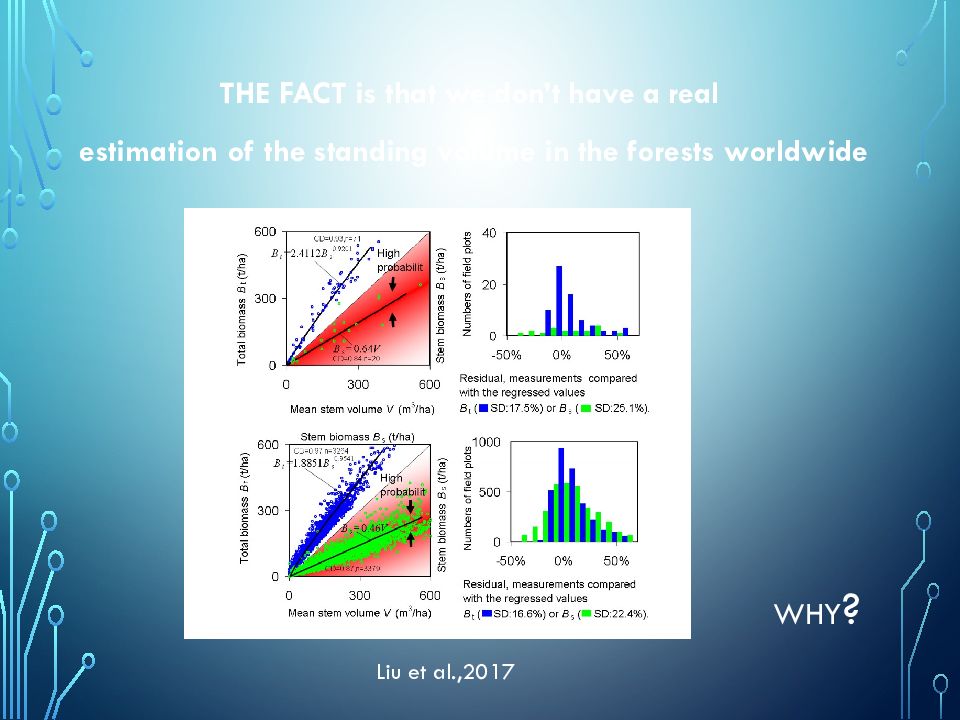
THE FACT is that we don ’t have a real estimation of the standing volume in the forests worldwide WHY ? Liu et al.,2017
Слайд 4: WHY?
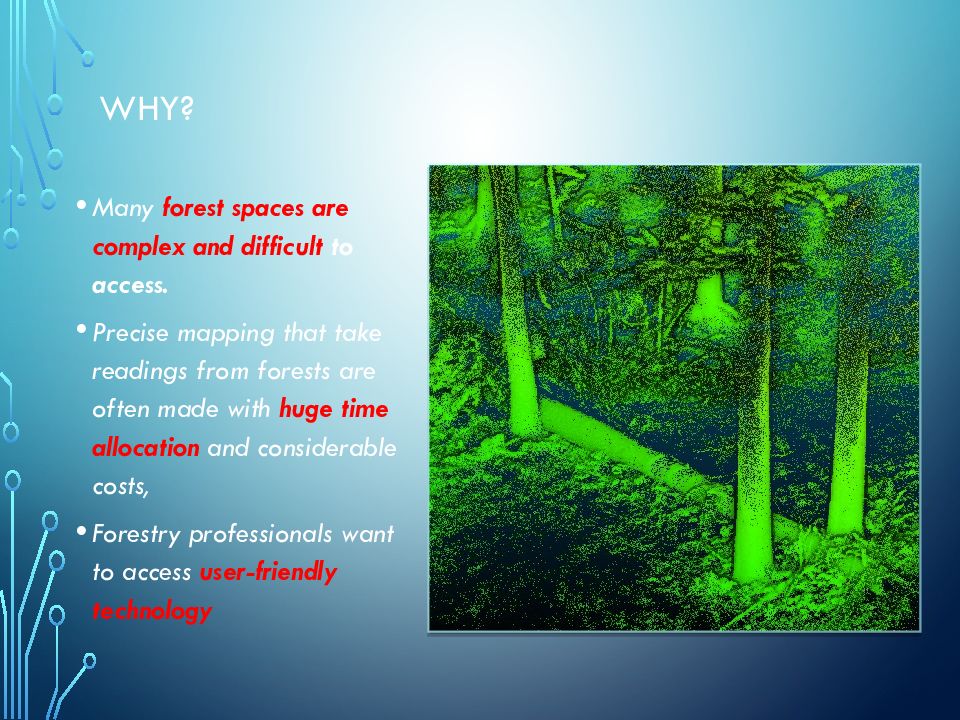
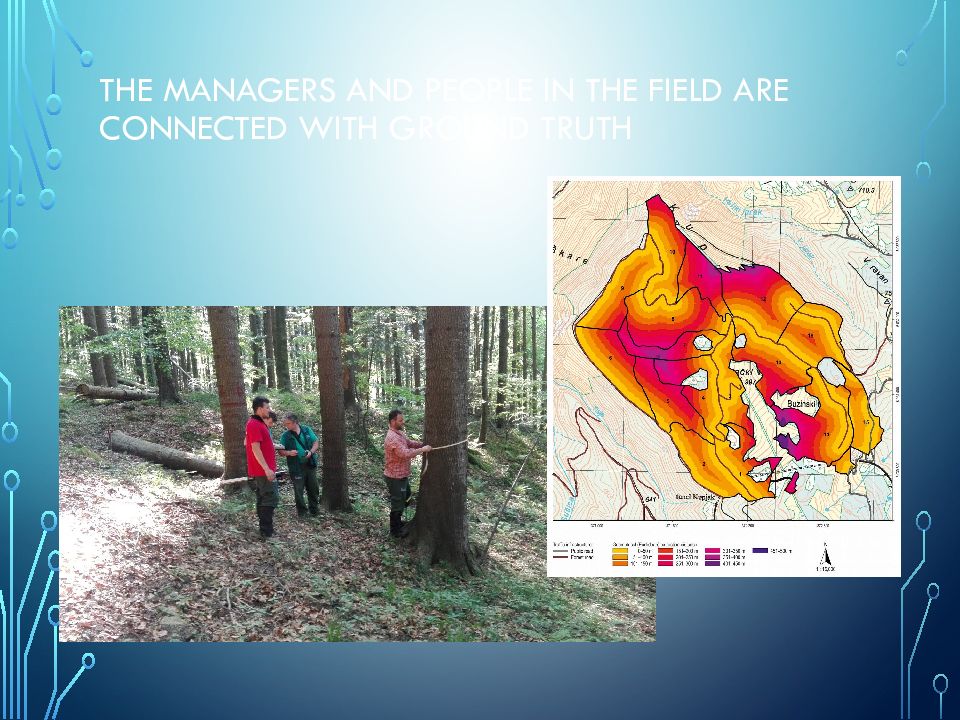
Many forest spaces are complex and difficult to access. Precise mapping that take readings from forests are often made with huge time allocation and considerable costs, Forestry professionals want to access user-friendly technology
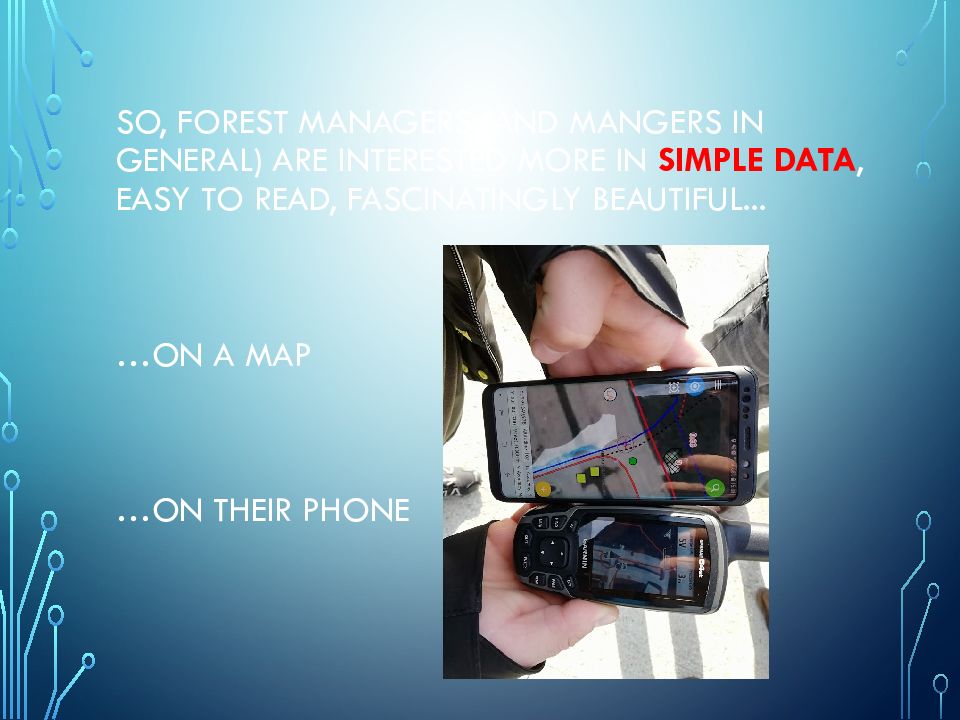
Слайд 7: SO, forest managers (and mangers in general) are interested more in simple data, easy to read, fascinatingly beautiful... …On a map …on their phone
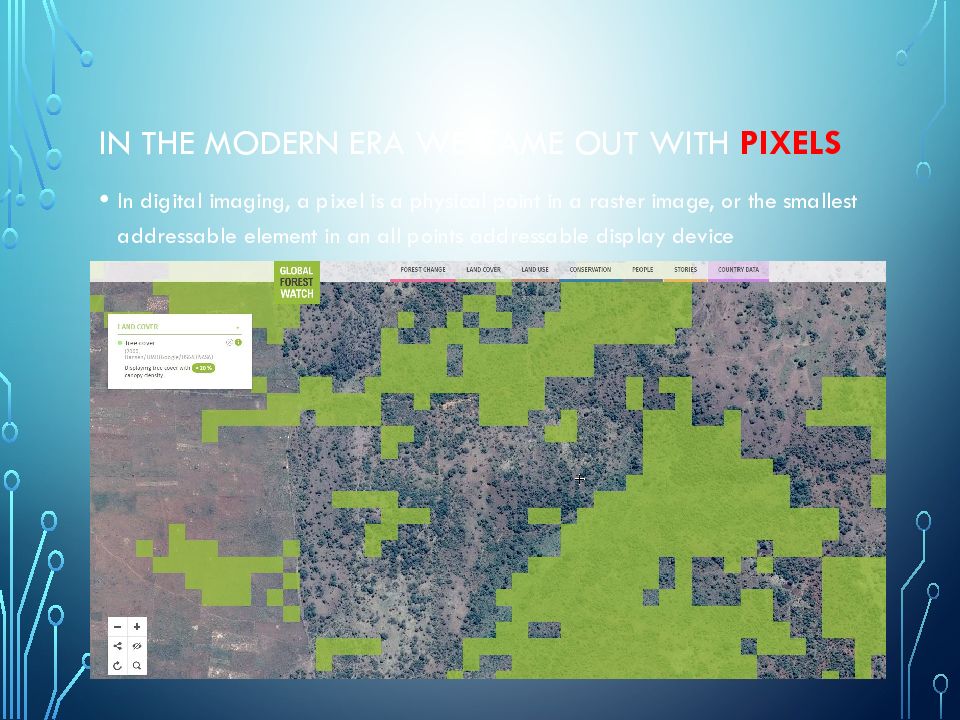
Слайд 8: IN THE MODERN ERA we came out with pixels
In digital imaging, a pixel is a physical point in a raster image, or the smallest addressable element in an all points addressable display device
Слайд 9: BUT WE ARE LIVING IN A 3D WORLD… NOWADAYS WE CAME OUT WITH voxels
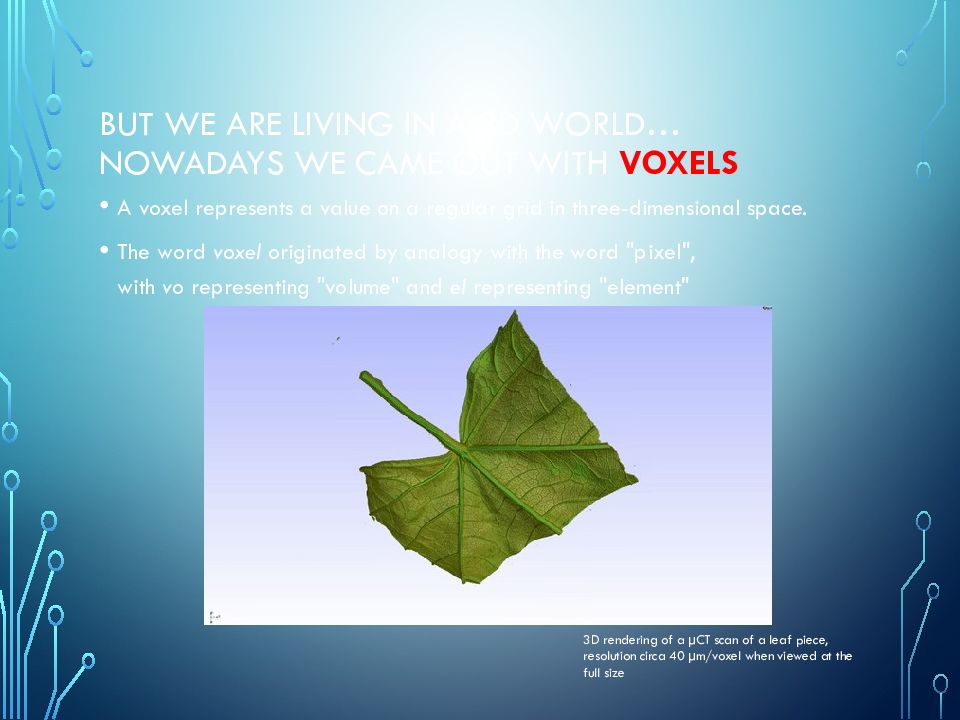
A voxel represents a value on a regular grid in three-dimensional space. The word voxel originated by analogy with the word "pixel", with vo representing "volume" and el representing "element" 3D rendering of a µCT scan of a leaf piece, resolution circa 40 µm/voxel when viewed at the full size
Слайд 10: What about forests?
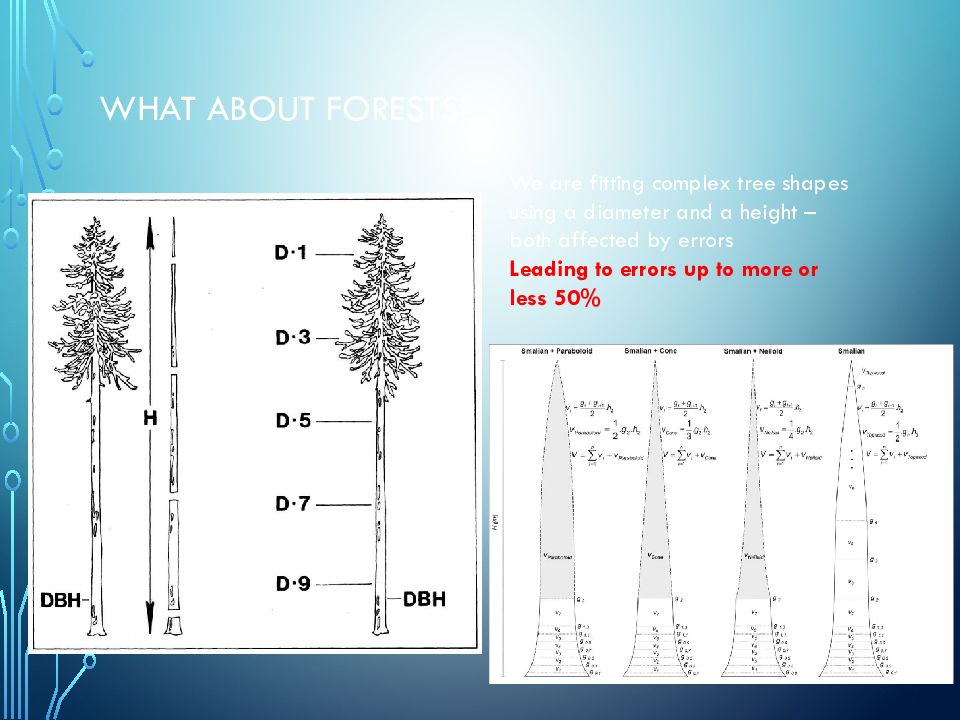
We are fitting complex tree shapes using a diameter and a height – both affected by errors Leading to errors up to more or less 50%
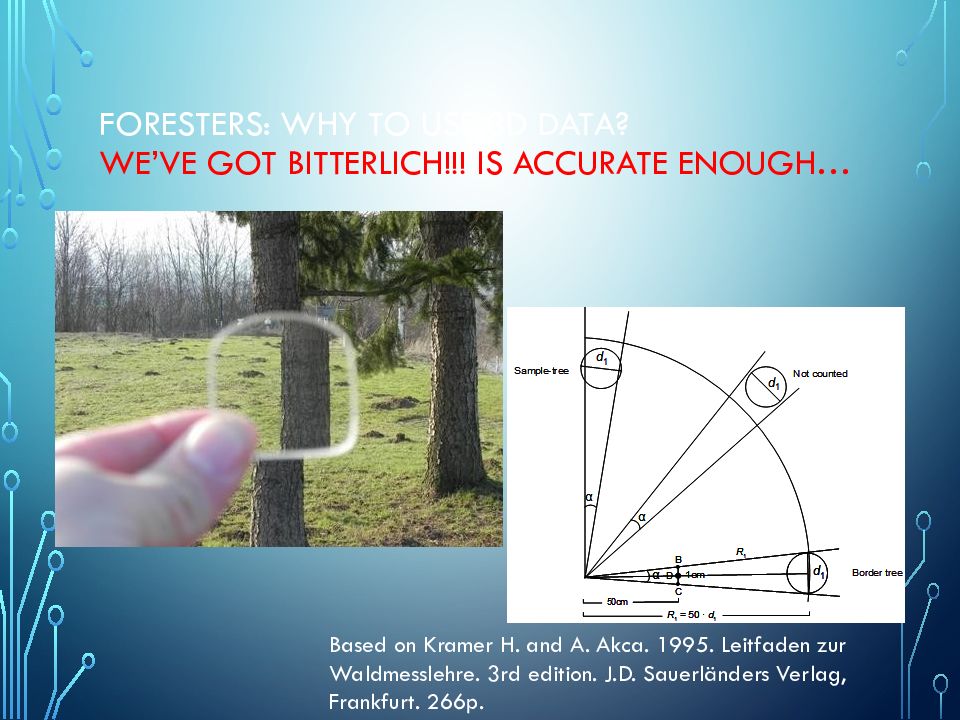
Слайд 11: ForesterS : Why to use 3d data? We’ve got bitterlich !!! Is accurate enough…
Based on Kramer H. and A. Akca. 1995. Leitfaden zur Waldmesslehre. 3rd edition. J.D. Sauerländers Verlag, Frankfurt. 266p.
Слайд 12: 3d scaNners – change in paradigm
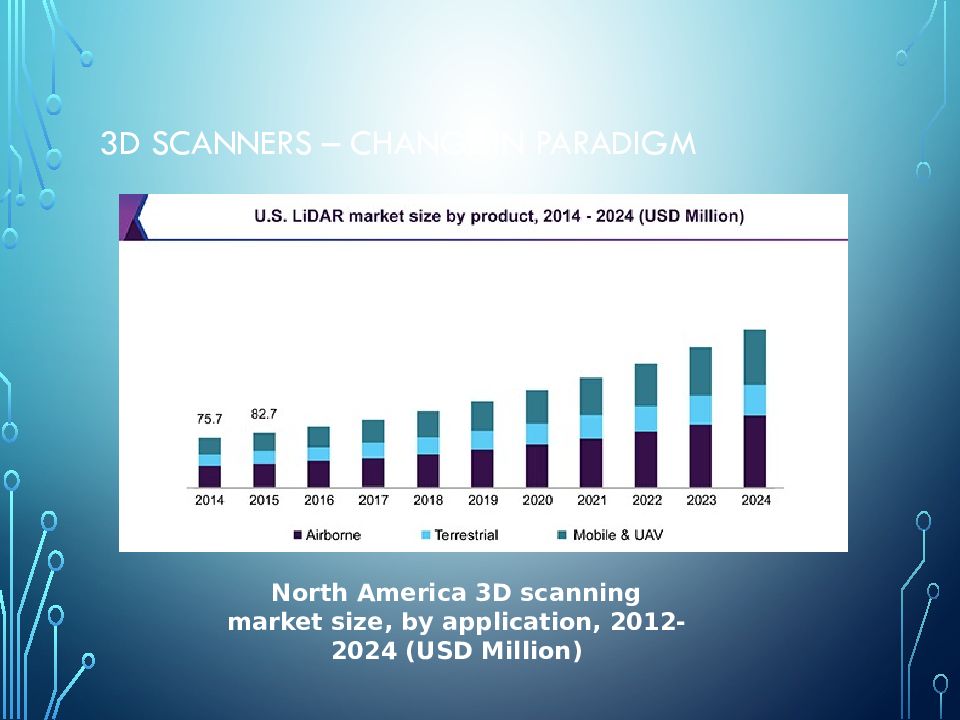
North America 3D scanning market size, by application, 2012-2024 (USD Million)
Слайд 13: Mobile Solution
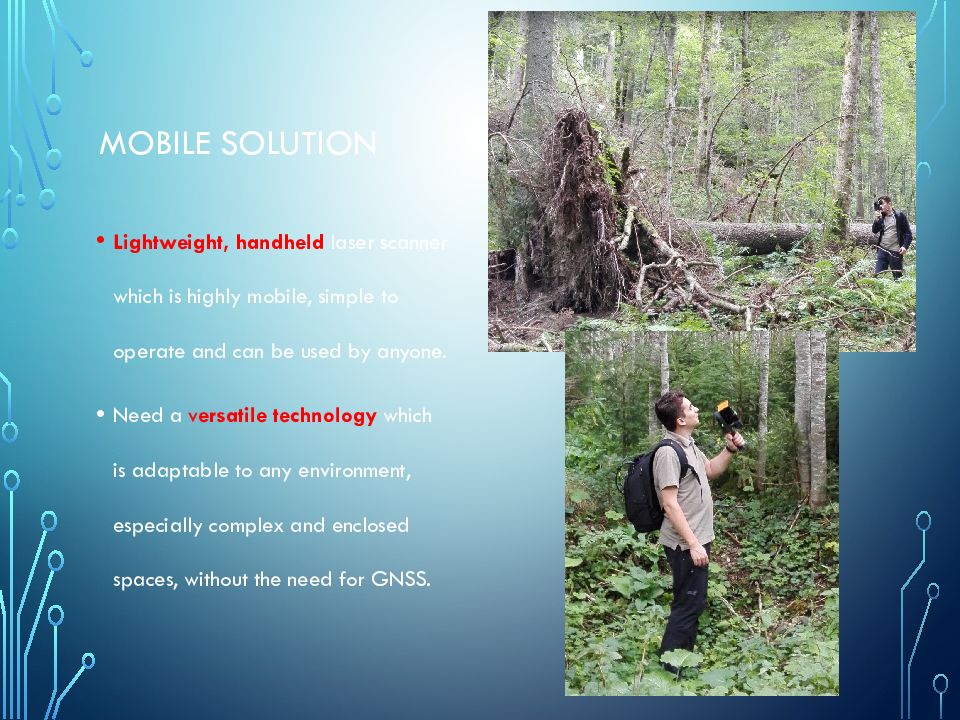
Lightweight, handheld laser scanner which is highly mobile, simple to operate and can be used by anyone. Need a v ersatile technology which is adaptable to any environment, especially complex and enclosed spaces, without the need for GNSS.
Слайд 14: Solution
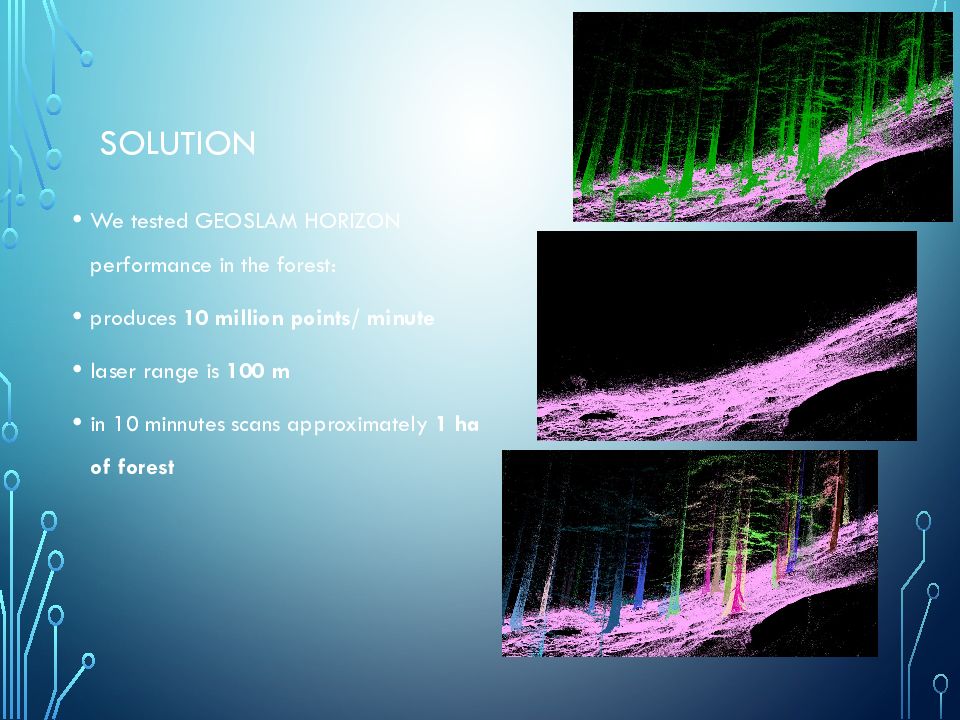
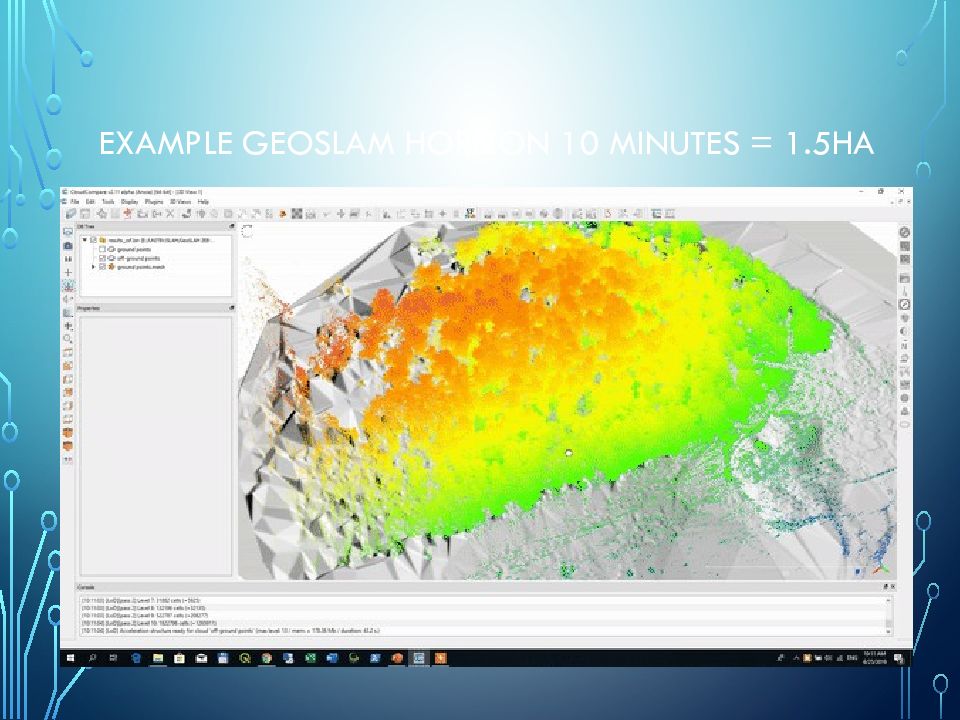
We tested GEOSLAM HORIZON performance in the forest: produces 10 million points/ minute laser range is 100 m in 10 minnutes scans approximately 1 ha of forest
Слайд 15: Principles of functioning
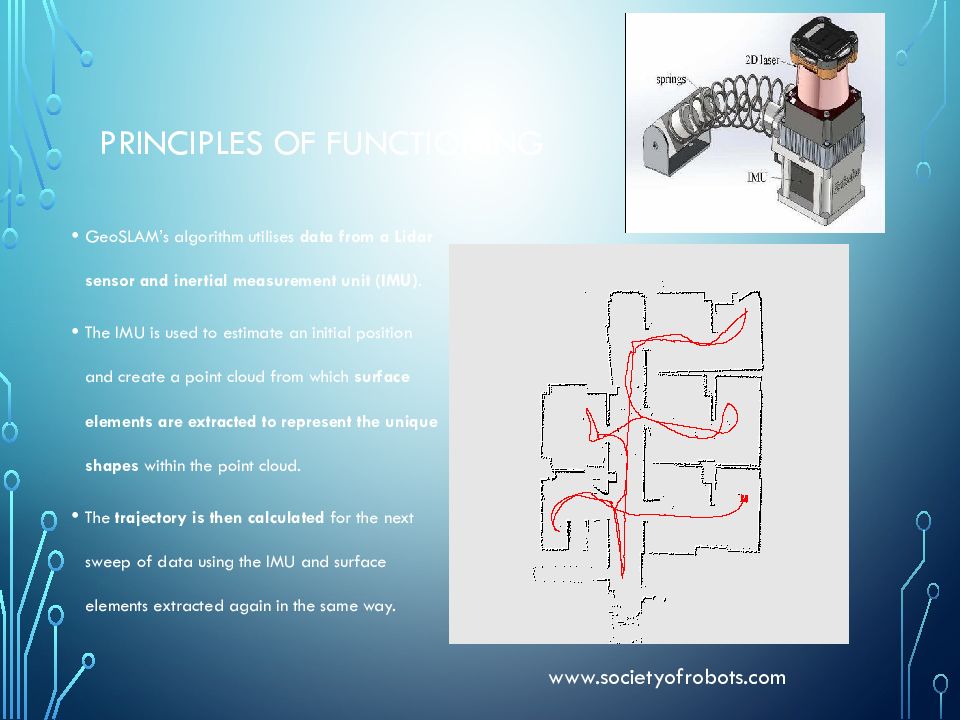
GeoSLAM’s algorithm utilises data from a Lidar sensor and inertial measurement unit (IMU). The IMU is used to estimate an initial position and create a point cloud from which surface elements are extracted to represent the unique shapes within the point cloud. The trajectory is then calculated for the next sweep of data using the IMU and surface elements extracted again in the same way. www.societyofrobots.com
Слайд 16: Principles of functioning
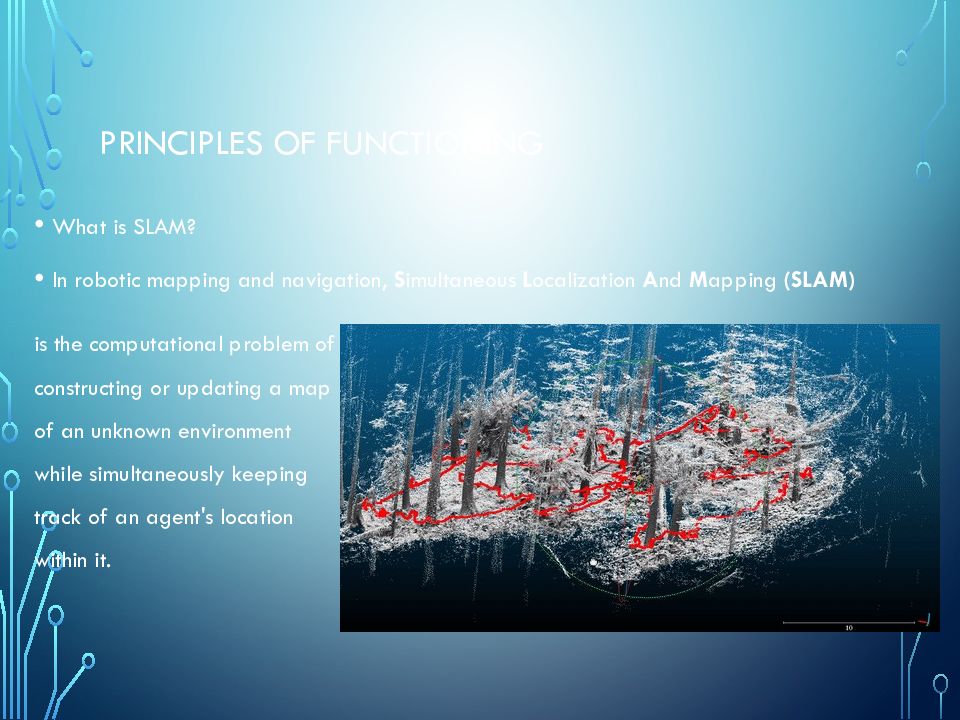
What is SLAM? In robotic mapping and navigation, S imultaneous L ocalization A nd M apping (SLAM) is the computational problem of constructing or updating a map of an unknown environment while simultaneously keeping track of an agent's location within it.
Слайд 21: Going back to the questions of forest managers:
What is the standing volume? What is the harvesting possibility and technology Selective logging for maintaining diverse structure for biodiversity? Can I get it in real-time? Etc.
Слайд 22: Semi- Automatic (manual) Tree Extraction and Virtual Measurements from LIDAR Imagery
Слайд 23
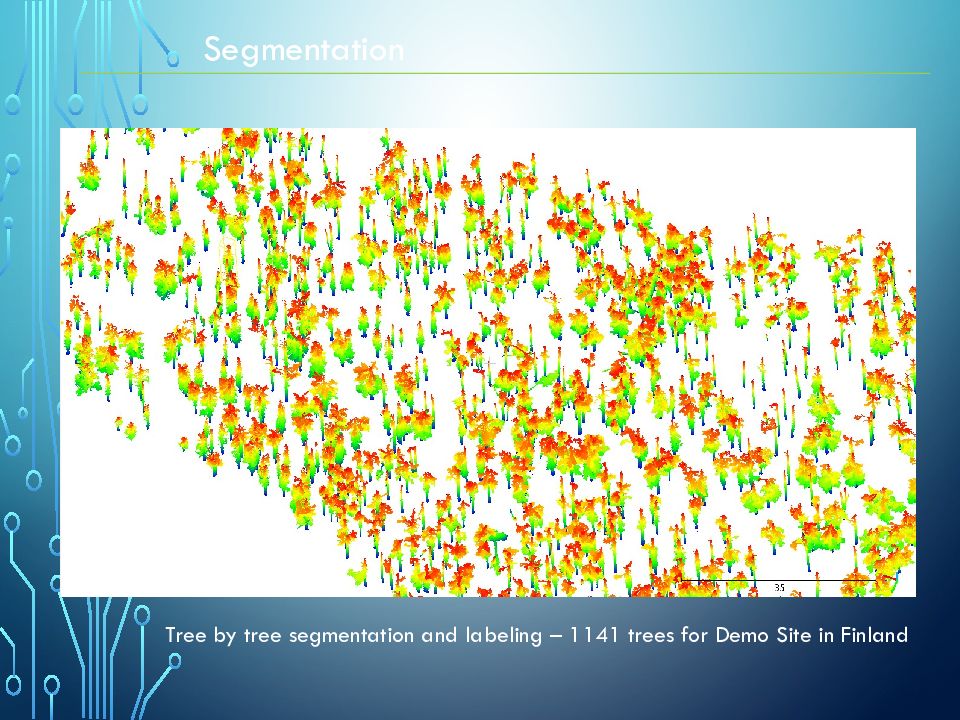
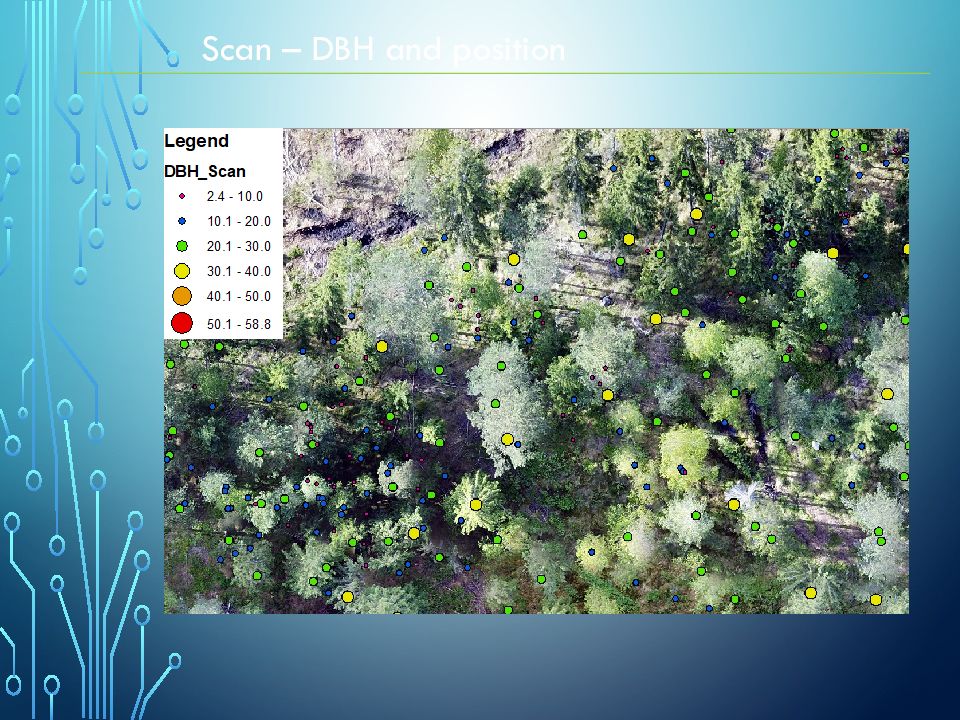
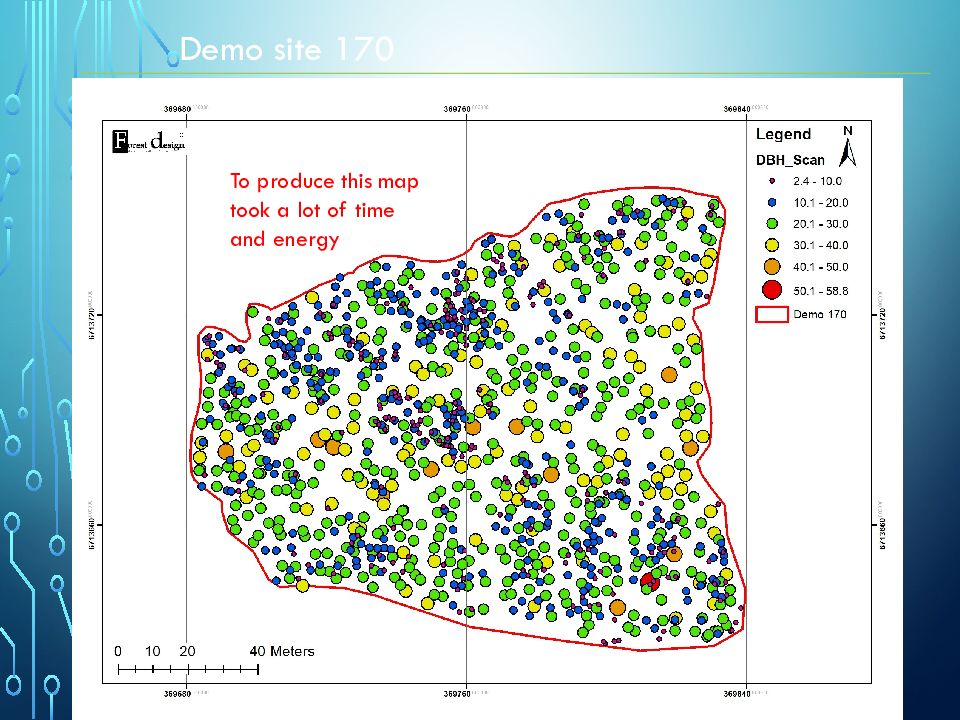
Segmentation Tree by tree segmentation and labeling – 1141 trees for Demo Site in Finland
Слайд 24
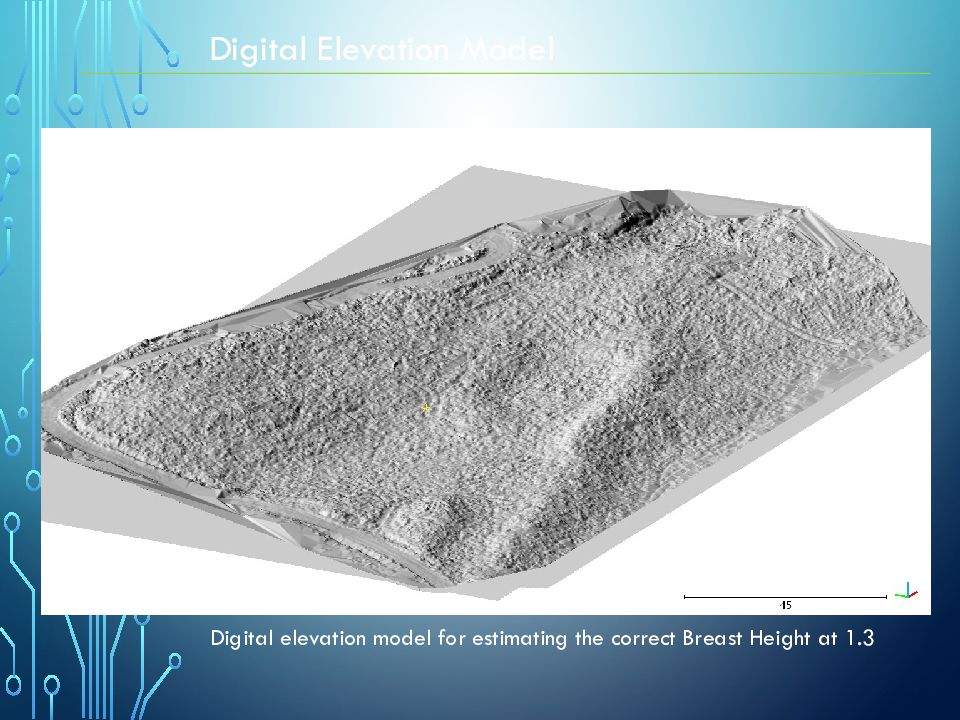
Digital Elevation Model Digital elevation model for estimating the correct Breast Height at 1.3
Слайд 25
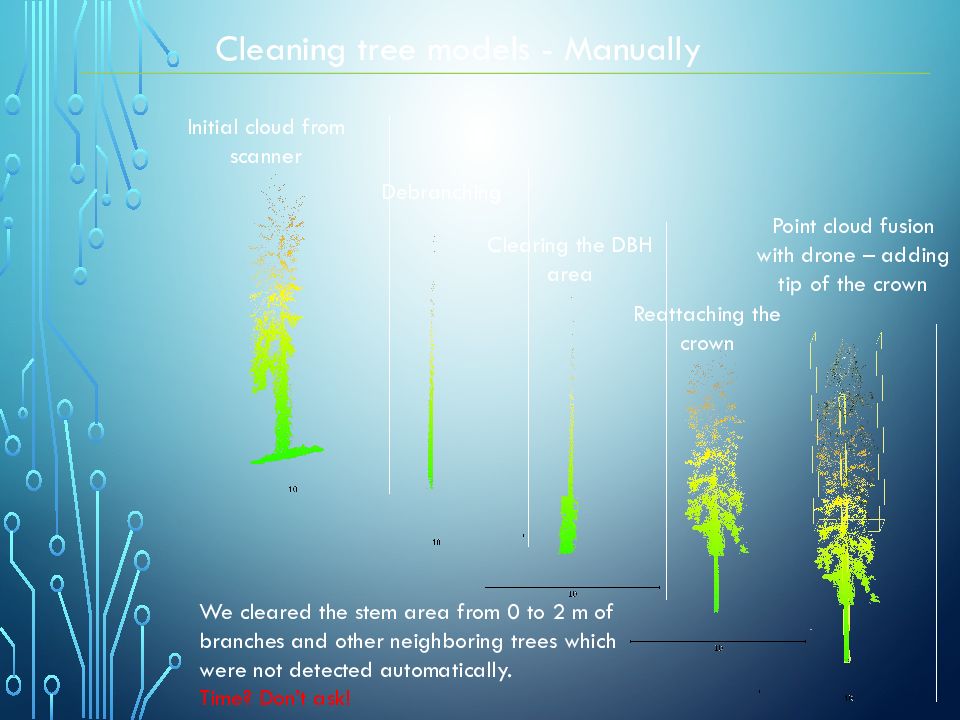
C leaning tree models - Manually We cleared the stem area from 0 to 2 m of branches and other neighboring trees which were not detected automatically. Time? Don’t ask! Point cloud fusion with drone – adding tip of the crown Initial cloud from scanner Debranching Clearing the DBH area Reattaching the crown
Слайд 26
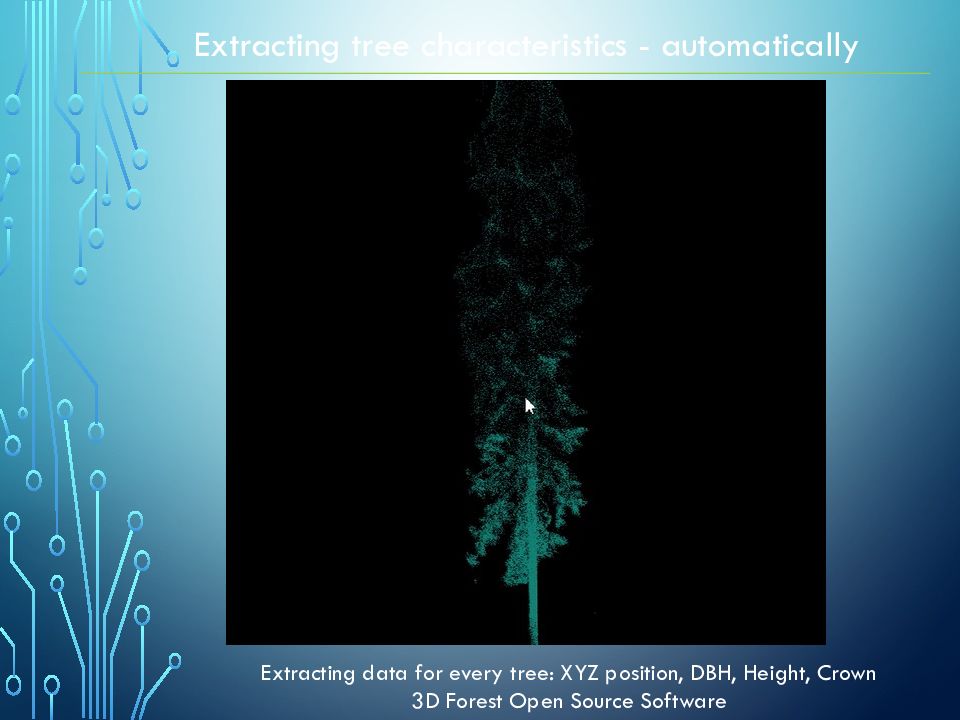
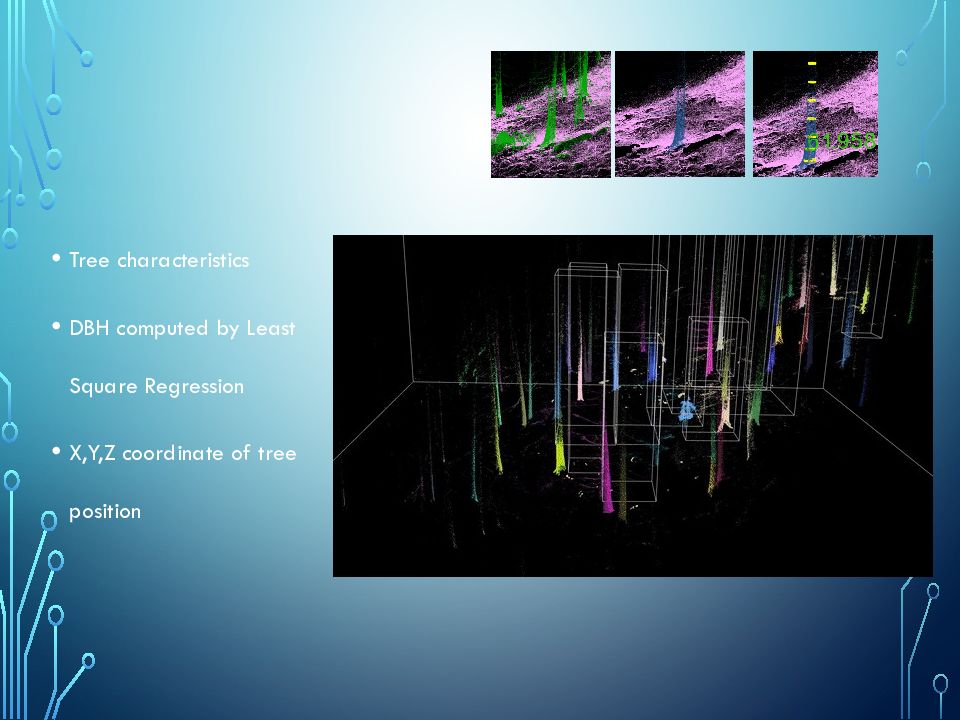
Extracting tree characteristics - automatically Extracting data for every tree: XYZ position, DBH, Height, Crown 3D Forest Open Source Software
Слайд 28
Tree characteristics DBH computed by Least Square Regression X,Y,Z coordinate of tree position
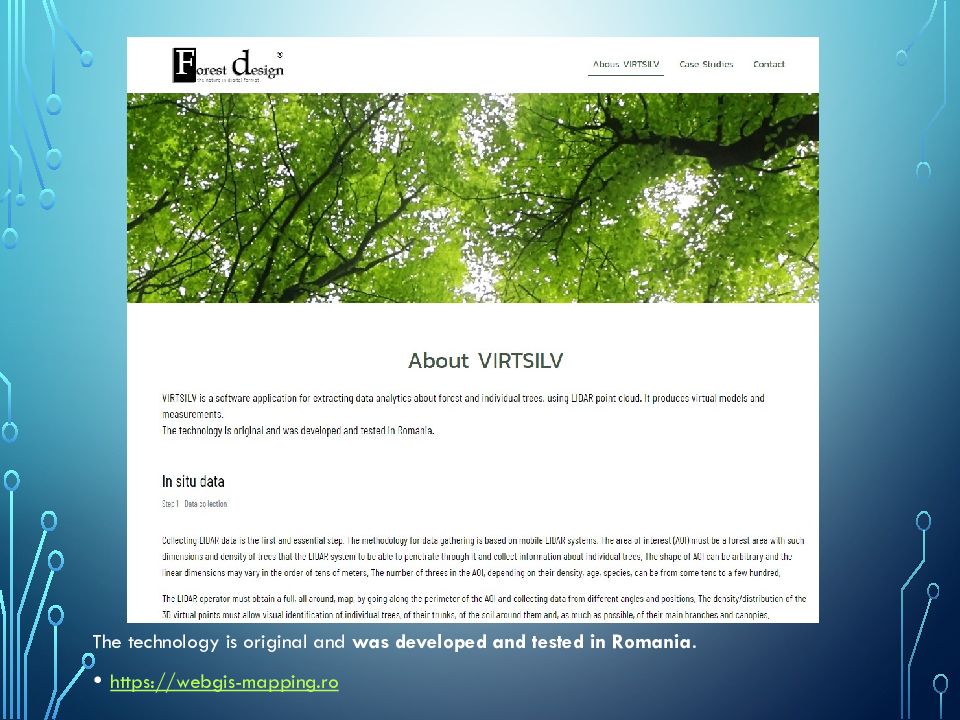
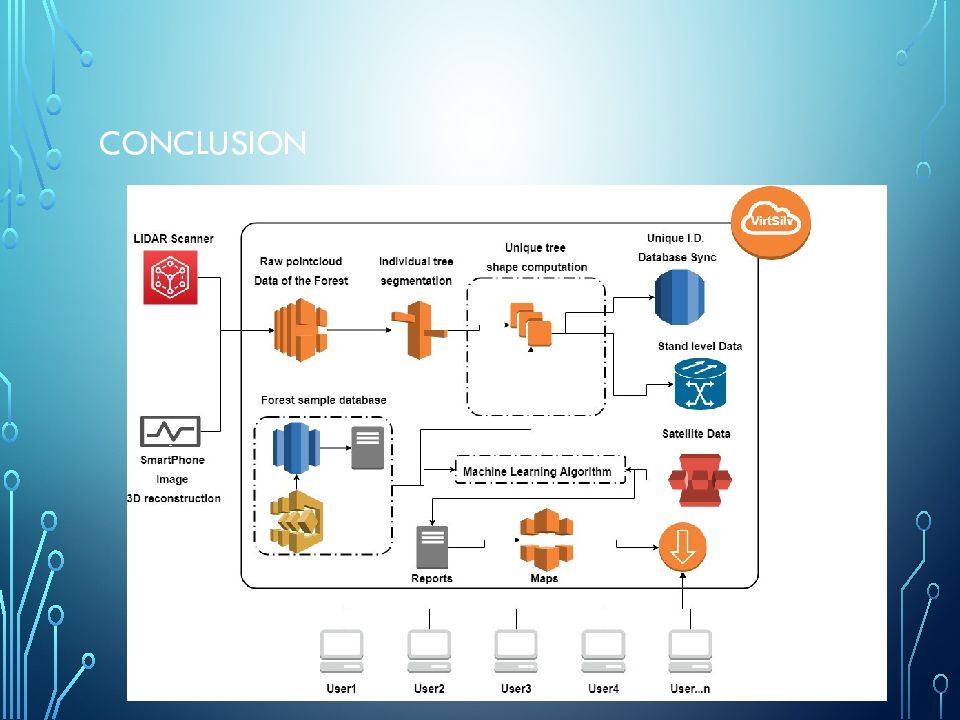
Слайд 30: VIRTSILV portal Automatic Tree Extraction and Virtual Measurements from LIDAR Imagery
Слайд 31
The technology is original and was developed and tested in Romania. https://webgis-mapping.ro
Слайд 35: settings
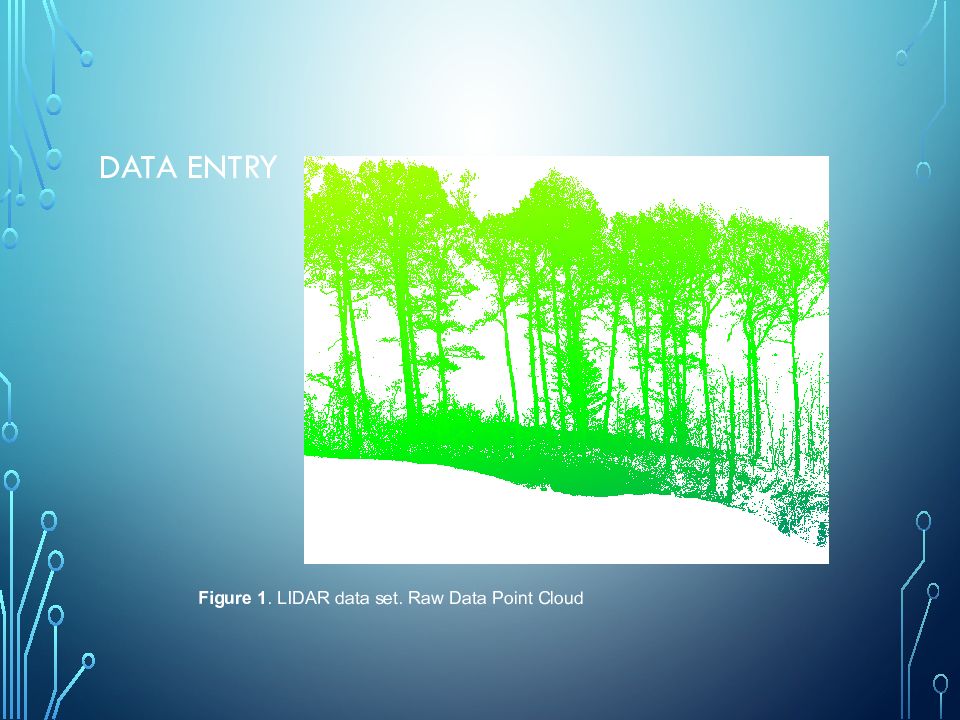
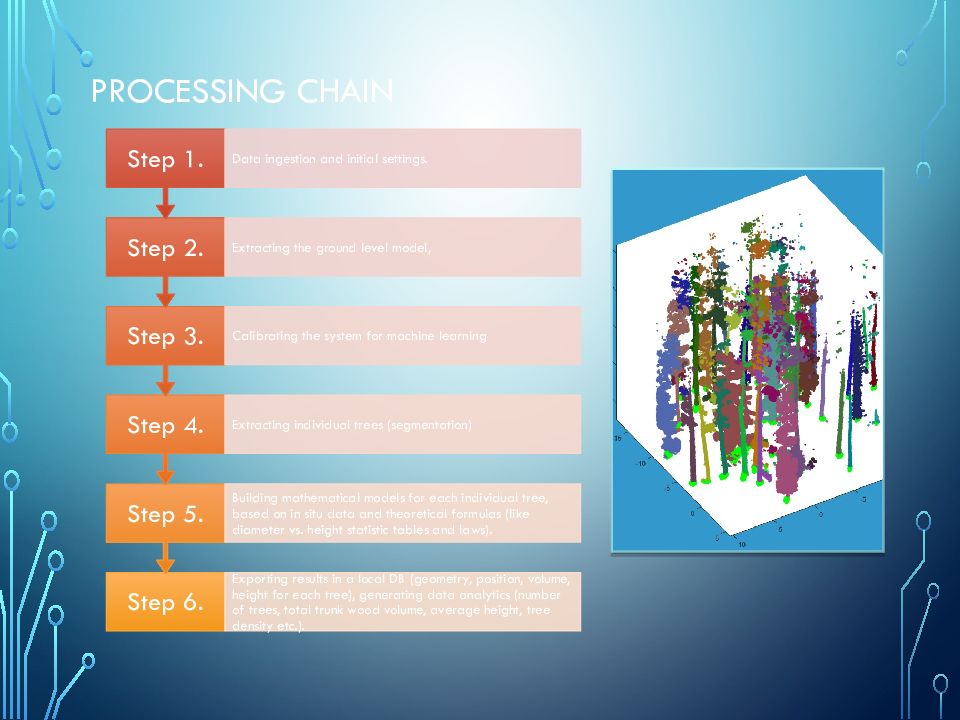
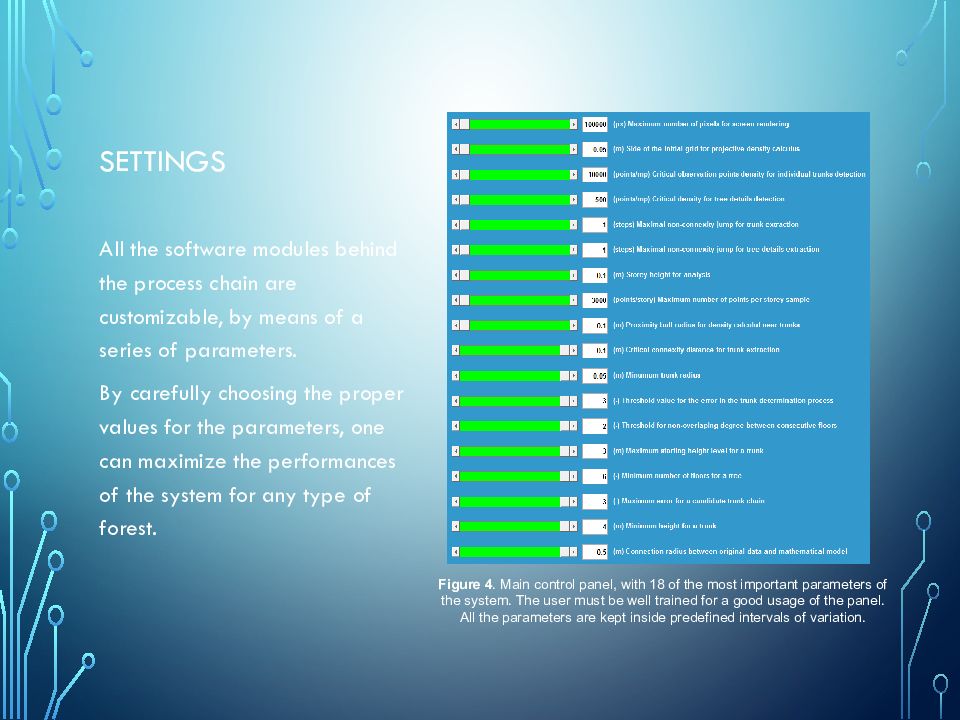
All the software modules behind the process chain are customizable, by means of a series of parameters. By carefully choosing the proper values for the parameters, one can maximize the performances of the system for any type of forest. Figure 4. Main control panel, with 18 of the most important parameters of the system. The user must be well trained for a good usage of the panel. All the parameters are kept inside predefined intervals of variation.
Слайд 36: results
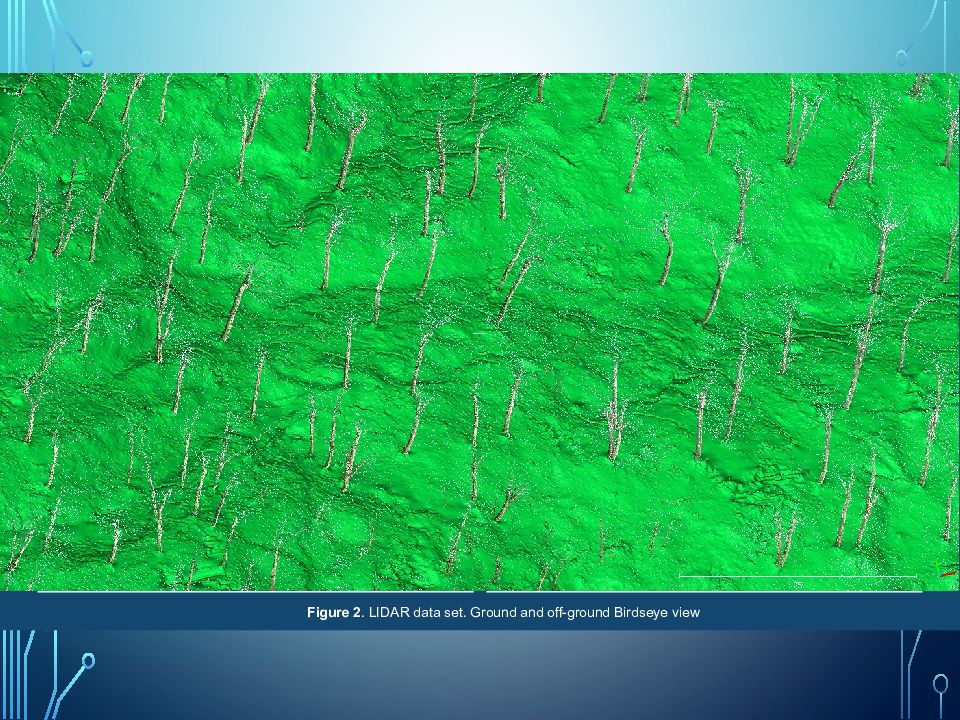
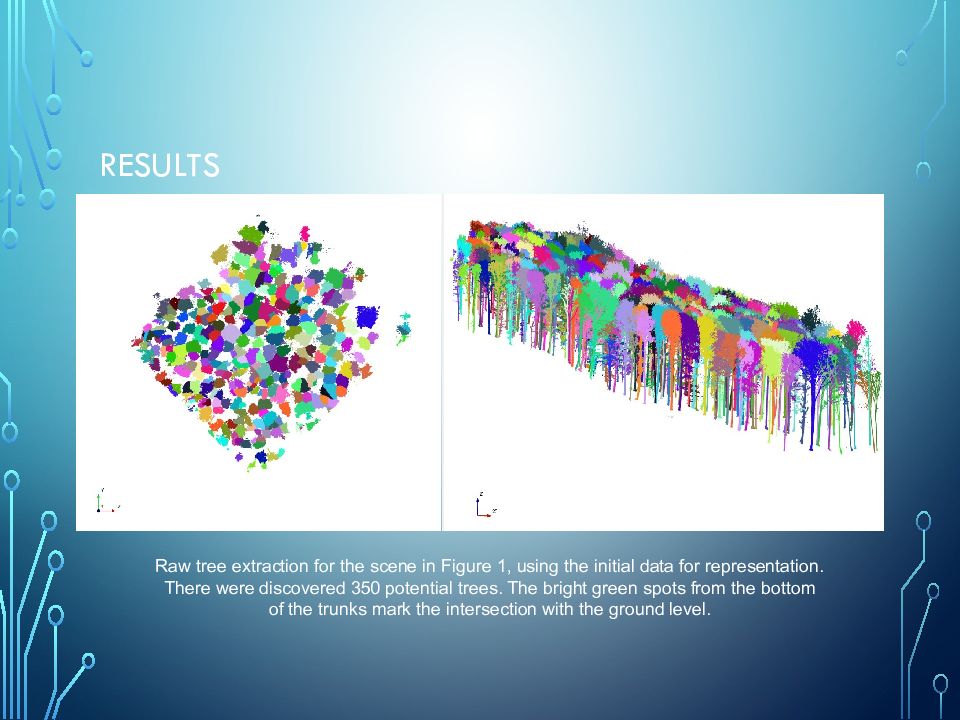
Raw tree extraction for the scene in Figure 1, using the initial data for representation. There were discovered 3 50 potential trees. The bright green spots from the bottom of the trunks mark the intersection with the ground level.
Слайд 37: Reconstructing Tree characteristics - trunk
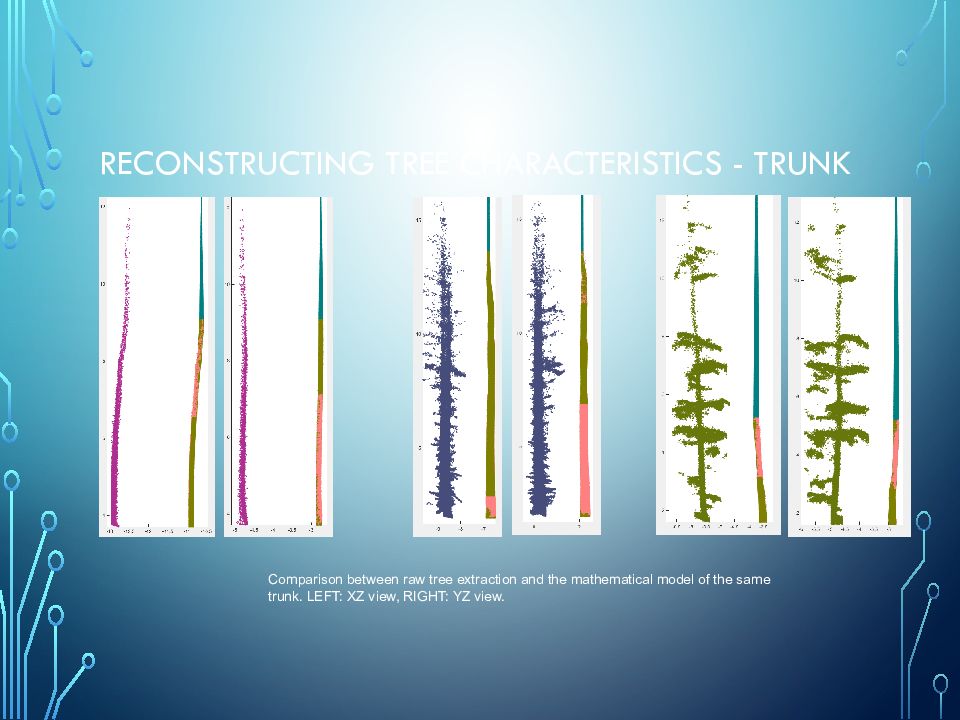
Comparison between raw tree extraction and the mathematical model of the same trunk. LEFT: XZ view, RIGHT: YZ view.
Слайд 42: Connecting to satellite data
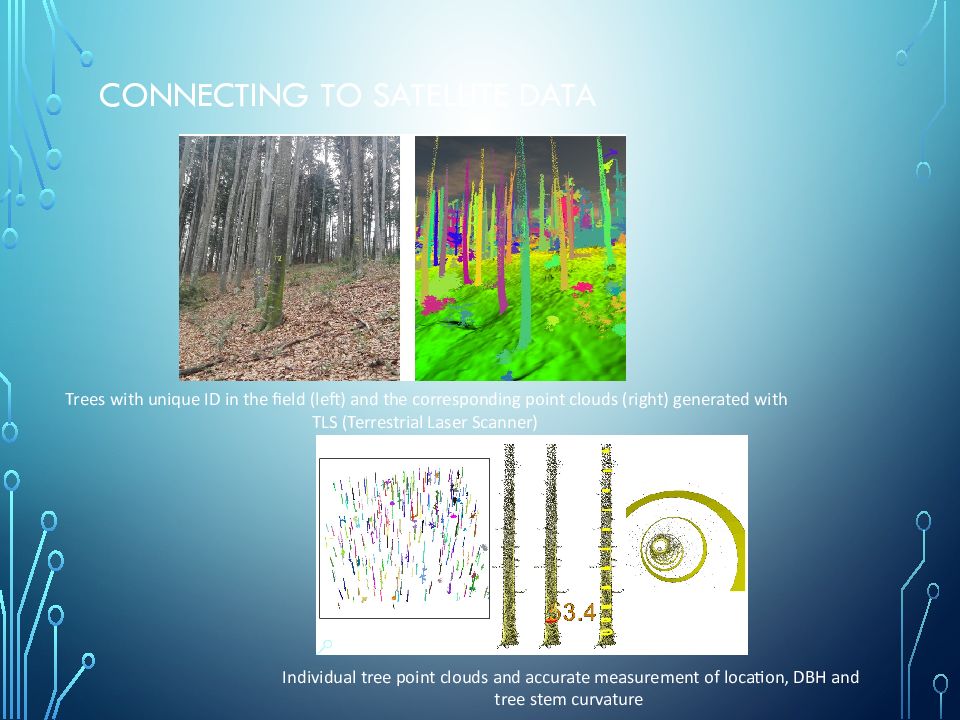
Trees with unique ID in the field (left) and the corresponding point clouds (right) generated with TLS (Terrestrial Laser Scanner) Individual tree point clouds and accurate measurement of location, DBH and tree stem curvature
Слайд 43: Connecting to satellite data
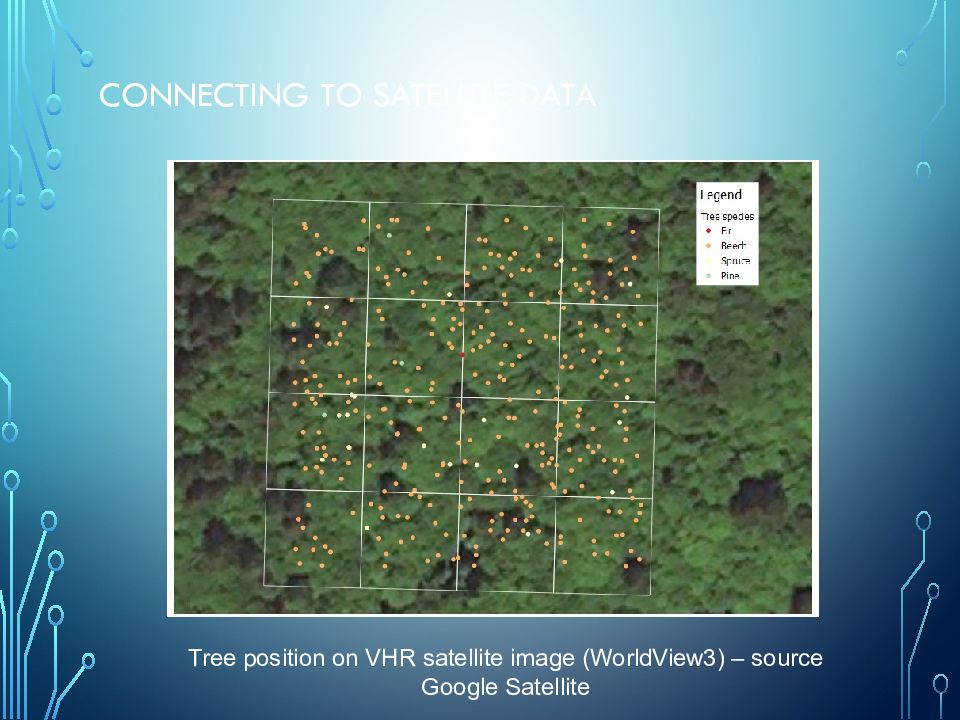
Tree position on VHR satellite image (WorldView3) – source Google Satellite
Слайд 44: Connecting to satellite data
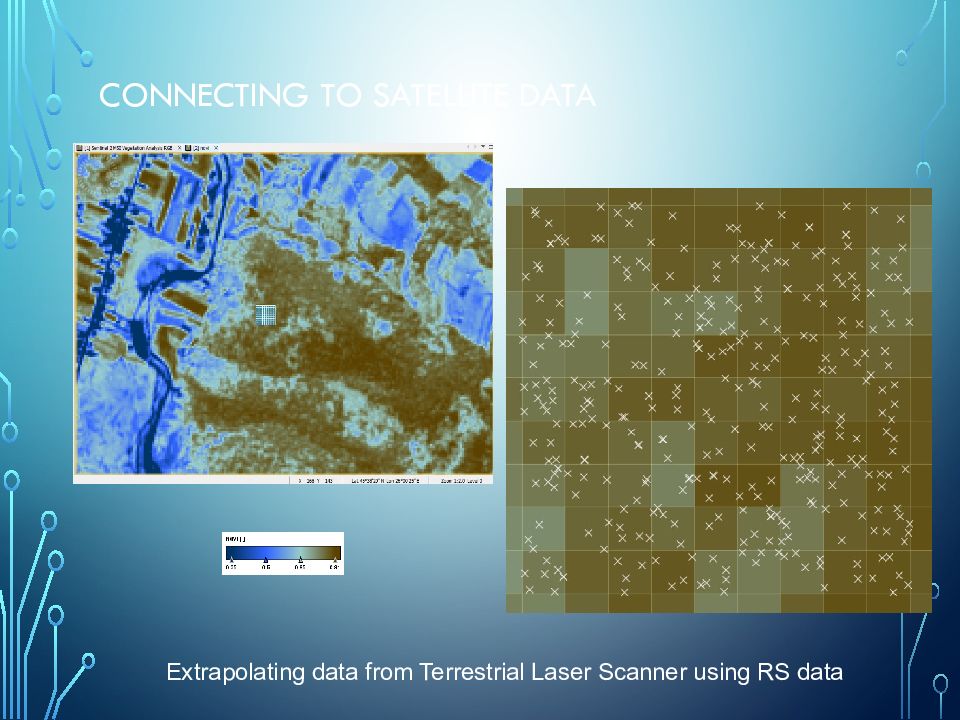
Extrapolating data from Terrestrial Laser Scanner using RS data
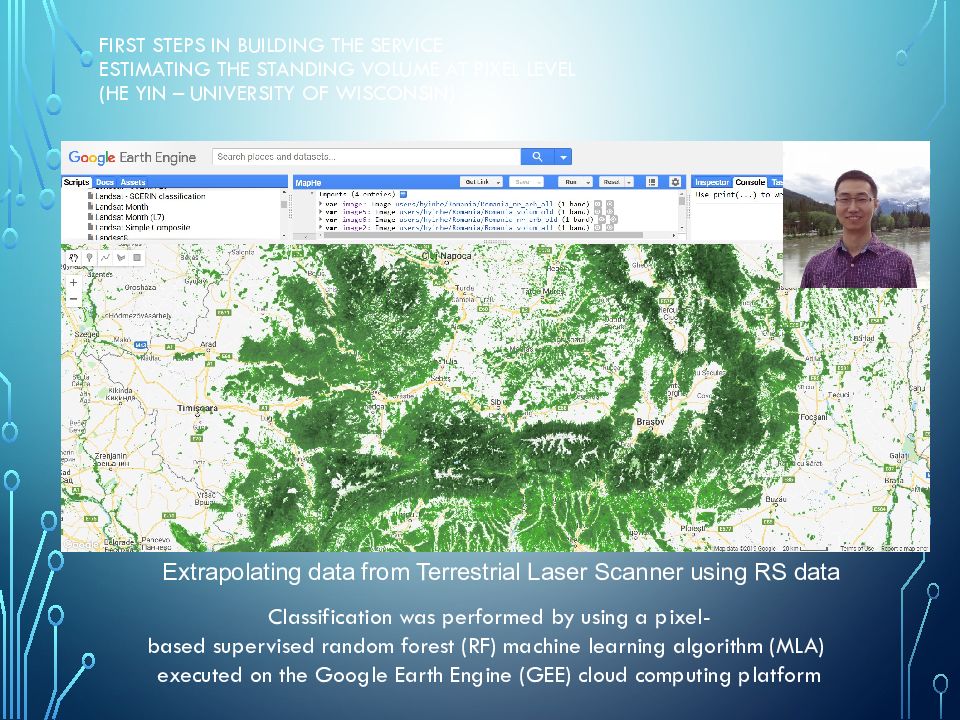
Слайд 45: FIRST STEPS in building the service estimating the standing volume at pixel level (HE YIN – University of Wisconsin)
Extrapolating data from Terrestrial Laser Scanner using RS data Classification was performed by using a pixel-based supervised random forest (RF) machine learning algorithm (MLA) executed on the Google Earth Engine (GEE) cloud computing platform
Слайд 46: Comparing with the field data – FMP1
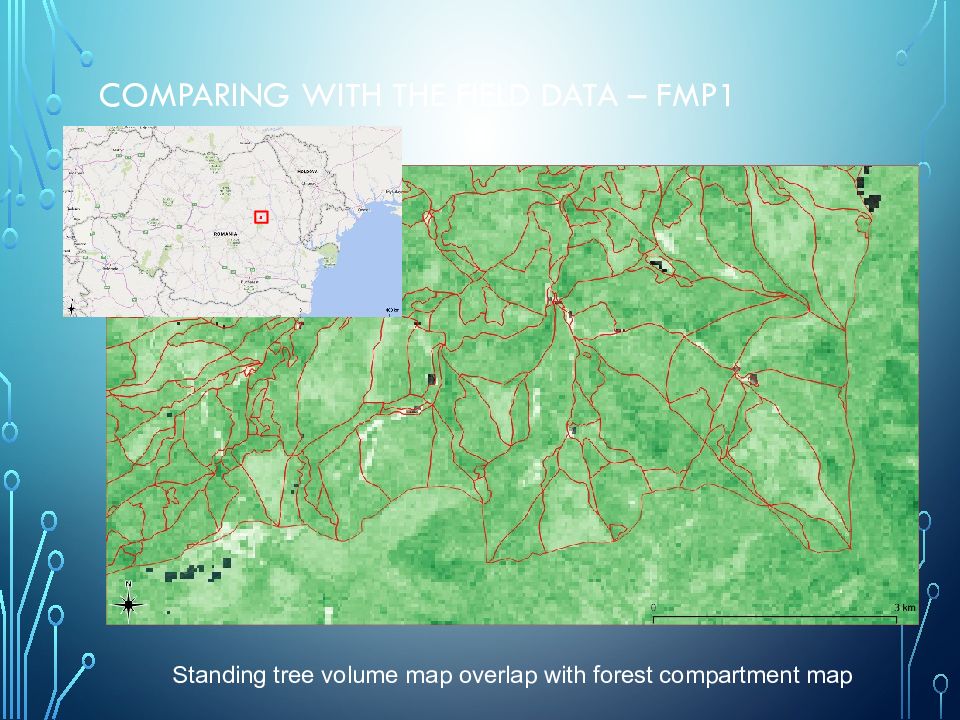
Standing tree volume map overlap with forest compartment map
Слайд 47: Comparing with the field data – FMP1
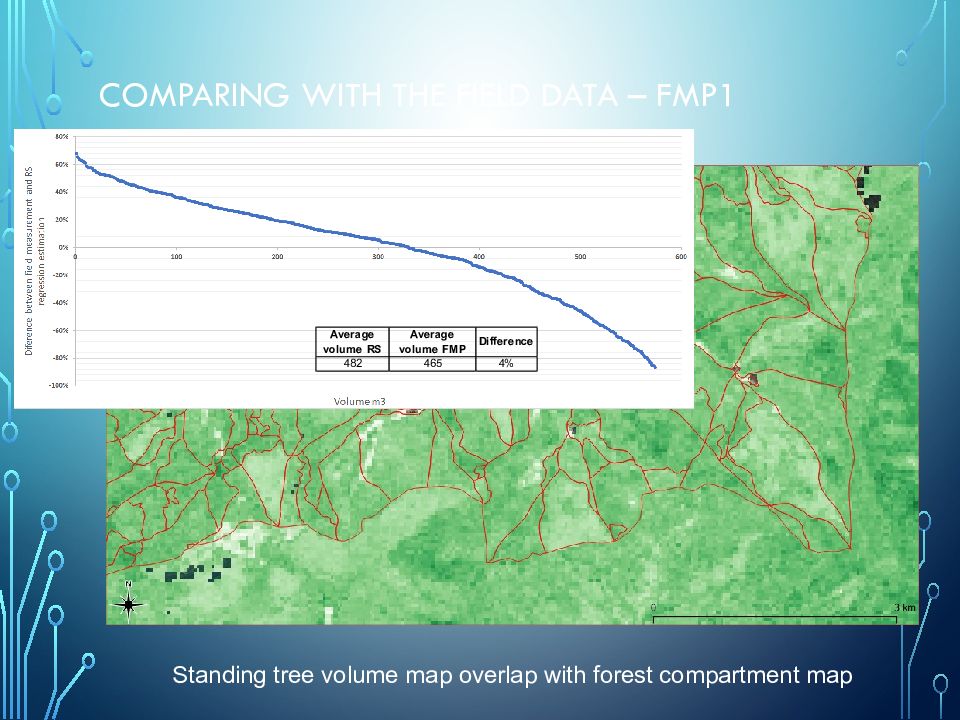
Standing tree volume map overlap with forest compartment map
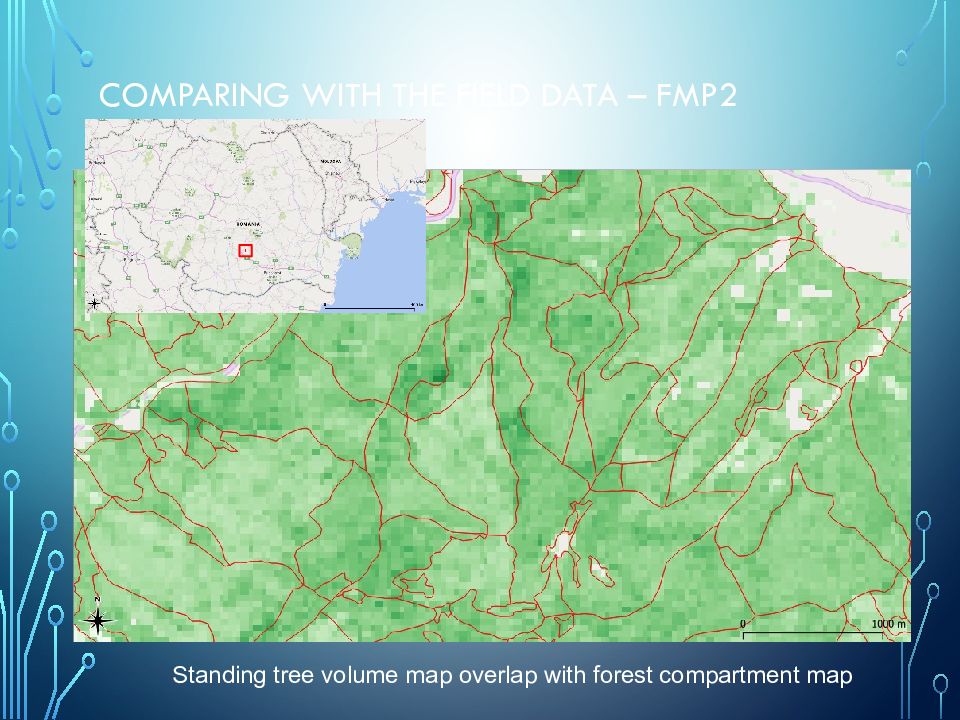
Слайд 48: Comparing with the field data – FMP2
Standing tree volume map overlap with forest compartment map
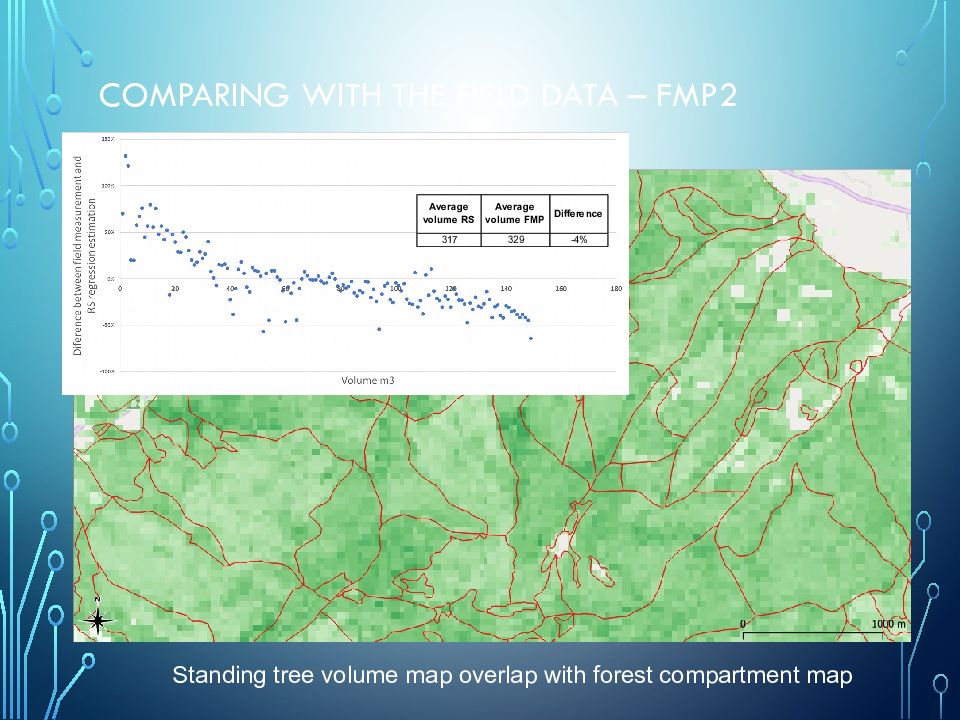
Слайд 49: Comparing with the field data – FMP2
Standing tree volume map overlap with forest compartment map
